Dashboard
Dashboard Overview
The central hub of our programmatic realm.
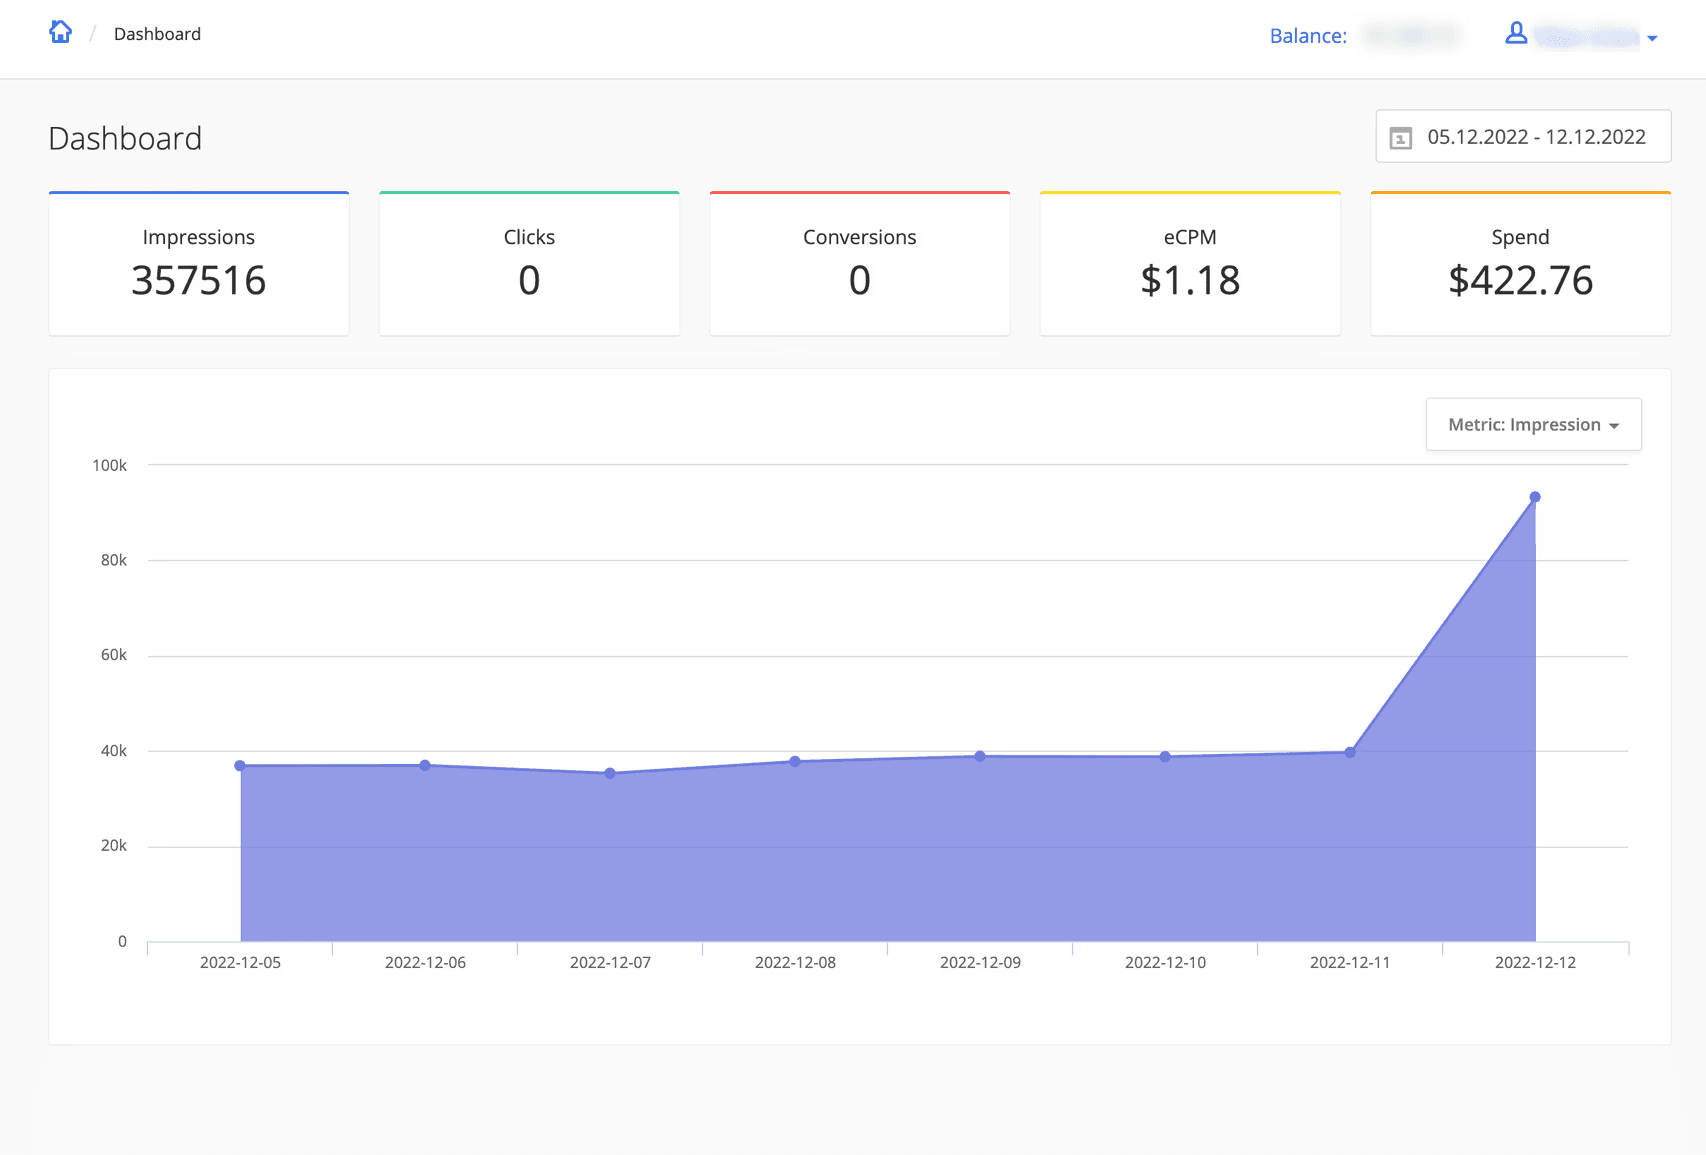
The Dashboard tab is the first thing you see when you log into the Adzora DSP. It provides a handy overview of the most important metrics.

By default the graph displays the Impressions for last week, but you can tweak the time range and the displayed metric.
You can use the calendar above the graph to adjust the time period for which the data is displayed.
The Metric dropdown allows you to switch between different metrics to be displayed on the graph: Impressions, Clicks, Conversions, eCPM or/and eCPC (depending on the type of campaigns - CMP or CPC - that you currently have active), and Spend.
More from
Dashboard

